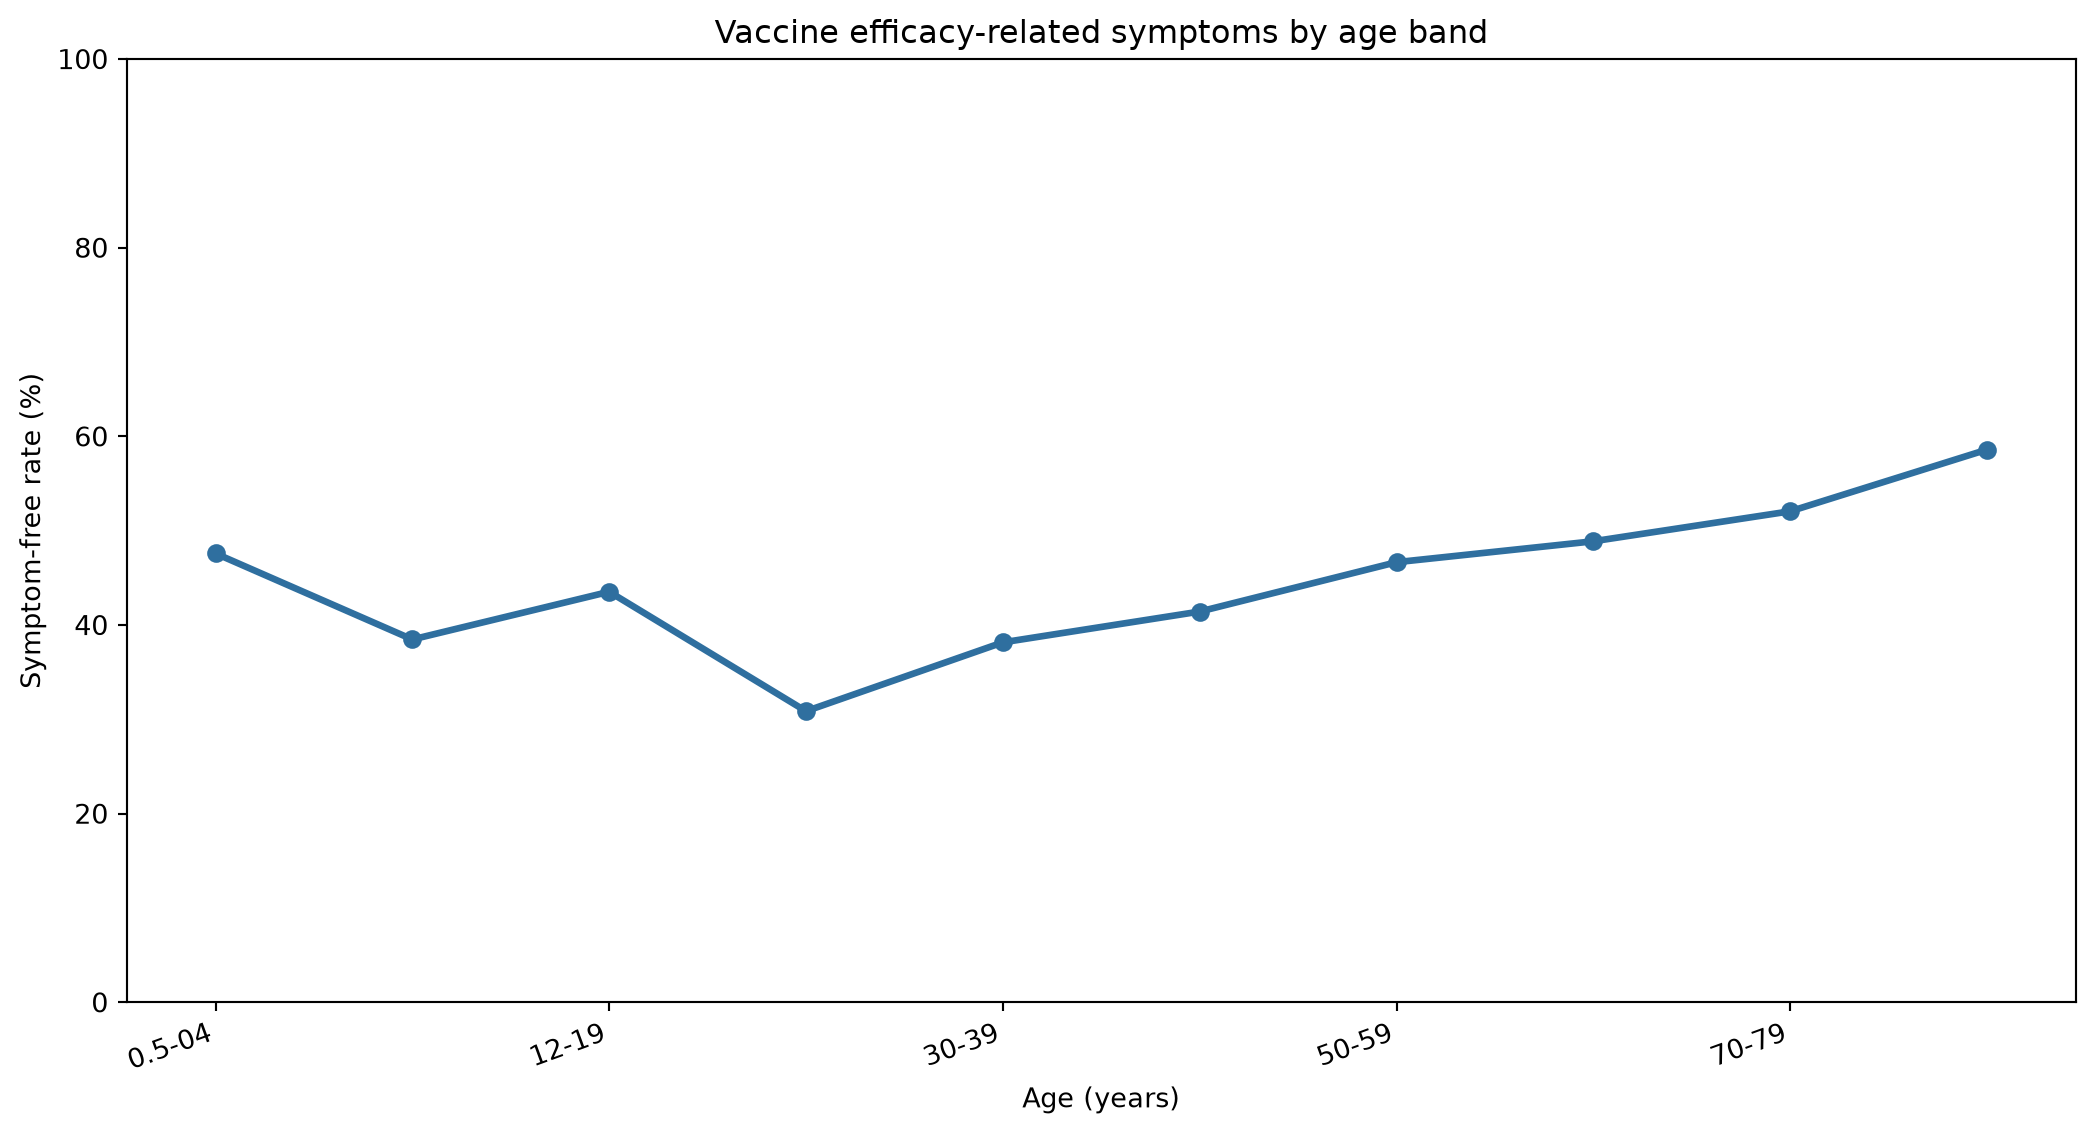
Post-Vaccination Symptoms by Age
Post-vaccination symptoms by age group
This line chart shows the observed symptom-free rate for each age band. The source age field only contains grouped age categories, so the chart keeps those categories on the x-axis instead of inventing exact ages.
This is still an exploratory visualization based on reported symptoms rather than a causal estimate of vaccine timing. Because the source data only reports age bands, the chart uses age categories rather than exact ages.